The population of the Murmansk region according to the Goskomstat of Russia is 748,056 people. (2019). The population density is 5.16 people / km² (2019). The urban population is 730,695 people (92.73%). According to this indicator, the region takes the 4th place in Russia (after Moscow , St. Petersburg and the Magadan region ) and the 2nd place in the North-West Federal District (second only to St. Petersburg ) [1] .
Content
- 1 population dynamics
- 2 National composition
- 3 Religion
- 4 Settlements
- 5 General map
- 6 notes
Population Dynamics
| Population size | ||||||
|---|---|---|---|---|---|---|
| 1926 [2] | 1931 [3] | 1933 [4] | 1959 [5] | 1970 [6] | 1979 [7] | 1987 [8] |
| 23 006 | ↗ 57,200 | ↗ 117 300 | ↗ 567 672 | ↗ 799 527 | ↗ 965 462 | ↗ 1,118,000 |
| 1989 [9] | 1990 [10] | 1991 [10] | 1992 [10] | 1993 [10] | 1994 [10] | 1995 [10] |
| ↗ 1,146,757 | ↗ 1,191,468 | ↘ 1,188,785 | ↘ 1,170,371 | ↘ 1,133,261 | ↘ 1 100 549 | ↘ 1 066 924 |
| 1996 [10] | 1997 [10] | 1998 [10] | 1999 [10] | 2000 [10] | 2001 [10] | 2002 [11] |
| ↘ 1 037 162 | ↘ 1 012 124 | ↘ 987 936 | ↘ 964 065 | ↘ 941 062 | ↘ 922 875 | ↘ 892 534 |
| 2003 [10] | 2004 [10] | 2005 [10] | 2006 [10] | 2007 [10] | 2008 [10] | 2009 [10] |
| ↘ 889 809 | ↘ 880 003 | ↘ 872 783 | ↘ 864 607 | ↘ 856 969 | ↘ 850 929 | ↘ 842 452 |
| 2010 [12] | 2011 [10] | 2012 [13] | 2013 [14] | 2014 [15] | 2015 [16] | 2016 [17] |
| ↘ 795 409 | ↘ 794 077 | ↘ 787 948 | ↘ 780 401 | ↘ 771 058 | ↘ 766 281 | ↘ 762 173 |
| 2017 [18] | 2018 [19] | 2019 [20] | ||||
| ↘ 757 621 | ↘ 753 557 | ↘ 748 056 | ||||
| Fertility (births per 1000 population) | ||||||||
|---|---|---|---|---|---|---|---|---|
| 1970 [21] | 1975 [21] | 1980 [21] | 1985 [21] | 1990 [21] | 1995 [21] | 1996 [21] | 1997 [21] | 1998 [21] |
| 15,5 | ↗ 17.0 | ↘ 16.1 | ↘ 15,6 | ↘ 11.5 | ↘ 8.1 | ↗ 8.3 | ↘ 7.8 | ↗ 8.1 |
| 1999 [21] | 2000 [21] | 2001 [21] | 2002 [21] | 2003 [22] | 2004 [22] | 2005 [22] | 2006 [22] | 2007 [23] |
| ↘ 7.6 | ↗ 8.2 | ↗ 8.6 | ↗ 9.2 | ↗ 9.9 | ↗ 10.2 | ↘ 9.8 | → 9.8 | ↗ 10.3 |
| 2008 [23] | 2009 [23] | 2010 [23] | 2011 [24] | 2012 [25] | 2013 [26] | 2014 [27] | ||
| ↗ 10.7 | ↗ 10.8 | ↗ 11.7 | ↘ 11.4 | ↗ 11.7 | ↗ 11.8 | → 11.8 | ||
| Mortality (deaths per 1000 population) | ||||||||
|---|---|---|---|---|---|---|---|---|
| 1970 [28] | 1975 [28] | 1980 [28] | 1985 [28] | 1990 [28] | 1995 [28] | 1996 [28] | 1997 [28] | 1998 [28] |
| 4.9 | ↗ 5.6 | ↗ 6.4 | ↘ 6.3 | ↘ 6.0 | ↗ 11.4 | ↘ 10.1 | ↘ 9.0 | ↘ 8.8 |
| 1999 [28] | 2000 [28] | 2001 [28] | 2002 [28] | 2003 [29] | 2004 [29] | 2005 [29] | 2006 [29] | 2007 [30] |
| ↗ 10.1 | ↗ 11.1 | ↗ 11.6 | ↗ 12.4 | ↗ 13.9 | ↘ 13.4 | ↗ 13.4 | ↘ 12.7 | ↘ 11.7 |
| 2008 [30] | 2009 [30] | 2010 [30] | 2011 [31] | 2012 [32] | 2013 [33] | 2014 [34] | ||
| ↗ 12.0 | ↗ 12.0 | ↘ 11.9 | ↘ 11.5 | ↘ 11.2 | ↘ 11.0 | ↗ 11.4 | ||
| Natural population growth (per 1000 people, the sign (-) means natural population decline) | ||||||||
|---|---|---|---|---|---|---|---|---|
| 1970 [35] | 1975 [36] | 1980 [37] | 1985 [38] | 1990 [39] | 1995 [40] | 1996 [41] | 1997 [42] | 1998 [43] |
| 10.6 | ↗ 11.4 | ↘ 9.7 | ↘ 9.3 | ↘ 5.5 | ↘ -3.3 | ↗ -1.8 | ↗ -1.2 | ↗ -0.7 |
| 1999 [44] | 2000 [45] | 2001 [46] | 2002 [47] | 2003 [48] | 2004 [48] | 2005 [48] | 2006 [48] | 2007 [49] |
| ↘ -2.5 | ↘ -2.9 | ↘ -3.0 | ↘ -3.2 | ↘ -4.0 | ↗ -3.2 | ↘ -3.6 | ↗ -2.9 | ↗ -1.4 |
| 2008 [49] | 2009 [49] | 2010 [49] | 2011 [50] | 2012 [51] | 2013 [52] | 2014 [53] | ||
| ↗ -1.3 | ↗ -1.2 | ↗ -0.2 | ↗ -0.1 | ↗ 0.5 | ↗ 0.8 | ↘ 0.4 | ||
| Life expectancy at birth (years) | ||||||||
|---|---|---|---|---|---|---|---|---|
| 1990 [54] | 1991 [54] | 1992 [54] | 1993 [54] | 1994 [54] | 1995 [54] | 1996 [54] | 1997 [54] | 1998 [54] |
| 70,2 | ↗ 70.4 | ↘ 67.8 | ↘ 64.5 | ↘ 62.5 | ↗ 63.0 | ↗ 64.7 | ↗ 66.9 | ↗ 67.6 |
| 1999 [54] | 2000 [54] | 2001 [54] | 2002 [54] | 2003 [54] | 2004 [54] | 2005 [54] | 2006 [54] | 2007 [54] |
| ↘ 66.0 | ↘ 64.5 | ↘ 64.0 | ↘ 63.5 | ↘ 63.0 | ↗ 63.6 | ↗ 63.8 | ↗ 65.2 | ↗ 66.7 |
| 2008 [54] | 2009 [54] | 2010 [54] | 2011 [55] | 2012 [55] | 2013 [55] | |||
| → 66.7 | ↗ 67.2 | ↗ 68.4 | ↗ 68.9 | ↗ 69.8 | ↗ 70.5 | |||
According to the All-Union and All-Russian censuses [56] [57] :
| year | 1959 | 1970 | 1979 | 1989 | 2002 | 2010 |
|---|---|---|---|---|---|---|
| the whole population, people | 567 672 | ▲ 799 527 | ▲ 965 462 | ▲ 1 146 757 | ▼ 892 534 | ▼ 795 409 |
| urban population | 531 586 | ▲ 708 565 | ▲ 863 277 | ▲ 1,056,296 | ▼ 823 215 | ▼ 738 382 |
| urban population, % | 93.6 | ▼ 88.6 | ▲ 89.4 | ▲ 92.1 | ▲ 92.2 | ▲ 92.8 |
National composition
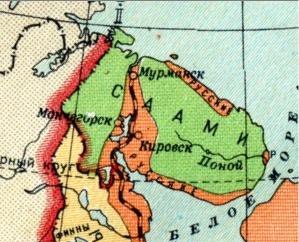
The indigenous population is the Sami (see Lapland ). Pomors live along the Terek coast .
| 1926 [58] people | % | 1939 [59] people | % | 1959 [60] people | % | 1989 [61] people | % | 2002 [62] people | % of Total | % of indicating shih national nal nost | 2010 [63] [64] people | % of Total | % of indicating shih national nal nost | |
|---|---|---|---|---|---|---|---|---|---|---|---|---|---|---|
| Total | 22858 | 100.00% | 291178 | 100.00% | 567672 | 100.00% | 1164586 | 100.00% | 892534 | 100.00% | 795409 | 100.00% | ||
| Russians | 16719 | 73.14% | 244693 | 84.04% | 484199 | 85.30% | 965727 | 82.92% | 760862 | 85.25% | 86.28% | 642310 | 80.75% | 88.97% |
| Ukrainians | 212 | 0.93% | 16730 | 5.75% | 32384 | 5.70% | 105079 | 9.02% | 56845 | 6.37% | 6.45% | 34268 | 4.31% | 4.75% |
| Belarusians | 121 | 0.53% | 4039 | 1.39% | 19996 | 3.52% | 38794 | 3.33% | 20335 | 2.28% | 2.31% | 12050 | 1.51% | 1.67% |
| Tatars | 311 | 1.36% | 4446 | 1.53% | 5566 | 0.98% | 11459 | 0.98% | 7944 | 0.89% | 0.90% | 5624 | 0.71% | 0.78% |
| Azerbaijanis | 17 | 0.01% | 172 | 0.03% | 2695 | 0.23% | 4614 | 0.52% | 0.52% | 3841 | 0.48% | 0.53% | ||
| Chuvashs | 22 | 0.10% | 452 | 0.16% | 962 | 0.17% | 3865 | 0.33% | 2759 | 0.31% | 0.31% | 1782 | 0.22% | 0.25% |
| Komi | 715 | 3.13% | 1121 | 0.38% | 1659 | 0.29% | 2167 | 0.19% | 2177 | 0.24% | 0.25% | 1649 | 0.21% | 0.23% |
| Mordva | 39 | 0.17% | 2248 | 0.77% | 2356 | 0.42% | 4214 | 0.36% | 2479 | 0.28% | 0.28% | 1625 | 0.20% | 0.23% |
| Armenians | one | 0.00% | 162 | 0.06% | 425 | 0.07% | 1521 | 0.13% | 1954 | 0.22% | 0.22% | 1618 | 0.20% | 0.22% |
| Saami | 1708 | 7.47% | 1755 | 0.60% | 1687 | 0.30% | 1615 | 0.14% | 1769 | 0.20% | 0.20% | 1599 | 0.20% | 0.22% |
| Karelians | 414 | 1.81% | 3804 | 1.31% | 3766 | 0.66% | 3505 | 0.30% | 2203 | 0.25% | 0.25% | 1376 | 0.17% | 0.19% |
| Moldavians | one | 0.00% | 45 | 0.02% | 505 | 0.09% | 3216 | 0.28% | 1974 | 0.22% | 0.22% | 1309 | 0.16% | 0.18% |
| Uzbeks | 49 | 0.02% | 159 | 0.03% | 872 | 0.07% | 463 | 0.05% | 0.05% | 1122 | 0.14% | 0.16% | ||
| Lezgins | fifteen | 0.01% | 484 | 0.04% | 840 | 0.09% | 0.10% | 951 | 0.12% | 0.13% | ||||
| Bashkirs | one | 0.00% | 214 | 0.07% | 183 | 0.03% | 1320 | 0.11% | 1162 | 0.13% | 0.13% | 914 | 0.11% | 0.13% |
| Mari | 59 | 0.02% | 203 | 0.04% | 1348 | 0.12% | 1037 | 0.12% | 0.12% | 852 | 0.11% | 0.12% | ||
| Germans | 51 | 0.22% | 970 | 0.33% | 345 | 0.06% | 1454 | 0.12% | 1211 | 0.14% | 0.14% | 725 | 0.09% | 0.10% |
| Poles | 127 | 0.56% | 538 | 0.18% | 1804 | 0.32% | 1836 | 0.16% | 1142 | 0.13% | 0.13% | 652 | 0.08% | 0.09% |
| Udmurts | four | 0.02% | 95 | 0.03% | 1029 | 0.18% | 1501 | 0.13% | 933 | 0.10% | 0.11% | 597 | 0.08% | 0.08% |
| Tabasarans | 71 | 0.01% | 303 | 0.03% | 0.03% | 521 | 0.07% | 0.07% | ||||||
| Kazakhs | 129 | 0.04% | 189 | 0.03% | 911 | 0.08% | 541 | 0.06% | 0.06% | 518 | 0.07% | 0.07% | ||
| Jews | 89 | 0.39% | 1627 | 0.56% | 3040 | 0.54% | 1919 | 0.16% | 675 | 0.08% | 0.08% | 457 | 0.06% | 0.06% |
| Georgians | 3 | 0.01% | 91 | 0.03% | 226 | 0.04% | 690 | 0.06% | 588 | 0.07% | 0.07% | 370 | 0.05% | 0.05% |
| Lithuanians | 26 | 0.11% | 73 | 0.03% | 2107 | 0.37% | 1289 | 0.11% | 607 | 0.07% | 0.07% | 354 | 0.04% | 0.05% |
| Ossetians | 57 | 0.02% | 131 | 0.02% | 560 | 0.05% | 541 | 0.06% | 0.06% | 347 | 0.04% | 0.05% | ||
| Tajiks | 9 | 0.00% | 189 | 0.02% | 257 | 0.03% | 0.03% | 332 | 0.04% | 0.05% | ||||
| Avars | one | 0.00% | 174 | 0.01% | 402 | 0.05% | 0.05% | 286 | 0.04% | 0.04% | ||||
| Bulgarians | one | 0.00% | thirty | 0.01% | 510 | 0.04% | 453 | 0.05% | 0.05% | 275 | 0.03% | 0.04% | ||
| Finns | 1697 | 7.42% | 4317 | 1.48% | 1197 | 0.21% | 590 | 0.05% | 426 | 0.05% | 0.05% | 273 | 0.03% | 0.04% |
| Dargins | 87 | 0.01% | 327 | 0.04% | 0.04% | 252 | 0.03% | 0.03% | ||||||
| other | 596 | 2.61% | 3344 | 1.15% | 3375 | 0.59% | 4870 | 0.42% | 4032 | 0.45% | 0.46% | 3076 | 0.39% | 0.43% |
| indicated nationality | 22858 | 100.00% | 291130 | 99.98% | 567665 | 100.00% | 1164532 | 100.00% | 881855 | 98.80% | 100.00% | 721925 | 90.76% | 100.00% |
| did not indicate nationality | 48 | 0.02% | 7 | 0.00% | 54 | 0.00% | 10679 | 1.20% | 73484 | 9.24% |
Religion
According to a large-scale survey of the Sreda research service, conducted in 2012, 40% of respondents chose the item “I profess Orthodoxy and belong to the Russian Orthodox Church” in the Murmansk Region, “I believe in God (in a higher power), but I don’t profess a particular religion” - 28% , “I do not believe in God” - 12%, “I profess Christianity, but I do not consider myself to be one of the Christian denominations” - 3%, “I profess Islam, but I am neither Sunni, nor Shiite” - 1%, “I profess traditional religion of ancestors, I worship the gods and forces of nature ”- <1% [65] [66] .
Settlements
- Settlements with a population of more than 8 thousand people
|
|
|
Community Map
Map legend (when you hover over the label, the actual population is displayed):
| The regional center, more than 250,000 people. | |
| from 20,000 to 100,000 | |
| from 10,000 to 20,000 people. | |
| from 5,000 to 10,000 | |
| from 2000 to 5000 people | |
| from 1000 to 2000 people |
Notes
- ↑ Estimation of the resident population of the Russian Federation as of January 1, 2012 (Unavailable link) . Date of treatment May 7, 2012. Archived June 23, 2012. ( xls )
- ↑ All-Union Population Census of 1926. M .: Edition of the Central Statistical Bureau of the USSR, 1928. Volume 9. Table I. Populated places. The present urban and rural population . Date of treatment February 7, 2015. Archived on February 7, 2015.
- ↑ Administrative and territorial division of the USSR: [Regions and cities of the USSR for 1931 ]. - Moscow: Power of the Soviets, 1931 .-- XXX, 311 p.
- ↑ Administrative territorial division of the USSR. On July 15, 1934.
- ↑ 1959 All-Union Census of the Population . Date of treatment October 10, 2013. Archived October 10, 2013.
- ↑ 1970 All-Union Census. The current population of cities, urban-type settlements, districts, and regional centers of the USSR according to the census as of January 15, 1970, in the republics, territories, and regions . Date of treatment October 14, 2013. Archived October 14, 2013.
- ↑ All-Union Census of 1979
- ↑ National Economy of the USSR for 70 years : anniversary statistical yearbook: [ arch. June 28, 2016 ] / USSR State Committee for Statistics . - Moscow: Finance and Statistics, 1987. - 766 p.
- ↑ All-Union Population Census of 1989 . Archived August 23, 2011.
- ↑ 1 2 3 4 5 6 7 8 9 10 11 12 13 14 15 16 17 18 19 20 Resident population as of January 1 (person) 1990-2013
- ↑ 2002 All-Russian Population Census. Tom. 1, table 4. The population of Russia, federal districts, constituent entities of the Russian Federation, districts, urban settlements, rural settlements - district centers and rural settlements with a population of 3 thousand or more . Archived February 3, 2012.
- ↑ Population Census 2010. Population of Russia, federal districts, constituent entities of the Russian Federation, urban districts, municipal districts, urban and rural settlements . Federal State Statistics Service. Date of treatment October 14, 2013. Archived on April 28, 2013.
- ↑ Population of the Russian Federation by municipalities. Table 35. Estimated resident population as of January 1, 2012 . Date of treatment May 31, 2014. Archived May 31, 2014.
- ↑ The population of the Russian Federation by municipalities as of January 1, 2013. - M.: Federal State Statistics Service of Rosstat, 2013. - 528 p. (Table 33. The population of urban districts, municipalities, urban and rural settlements, urban settlements, rural settlements) . Date of treatment November 16, 2013. Archived November 16, 2013.
- ↑ Table 33. The population of the Russian Federation by municipalities as of January 1, 2014 . Date of treatment August 2, 2014. Archived on August 2, 2014.
- ↑ The population of the Russian Federation by municipalities as of January 1, 2015 . Date of treatment August 6, 2015. Archived on August 6, 2015.
- ↑ Population of the Russian Federation by municipalities as of January 1, 2016
- ↑ The population of the Russian Federation by municipalities as of January 1, 2017 (July 31, 2017). Date of treatment July 31, 2017. Archived July 31, 2017.
- ↑ Population of the Russian Federation by municipalities as of January 1, 2018 . Date of treatment July 25, 2018. Archived July 26, 2018.
- ↑ 1 2 3 4 5 6 7 8 9 10 11 12 13 14 15 16 17 18 The population of the Russian Federation by municipalities as of January 1, 2019 . Date of treatment July 31, 2019.
- ↑ 1 2 3 4 5 6 7 8 9 10 11 12 13 5.13. Fertility, mortality and natural population growth by region of the Russian Federation
- ↑ 1 2 3 4 4.22. Fertility, mortality and natural population growth in the constituent entities of the Russian Federation
- ↑ 1 2 3 4 4.6. Fertility, mortality and natural population growth in the constituent entities of the Russian Federation
- ↑ Fertility, mortality, natural growth, marriage, divorce rates for January-December 2011
- ↑ Fertility, mortality, natural growth, marriage, divorce rates for January-December 2012
- ↑ Fertility, mortality, natural growth, marriage, divorce rates for January-December 2013
- ↑ Fertility, mortality, natural growth, marriage, divorce rates for January-December 2014
- ↑ 5.13. Fertility, mortality and natural population growth by region of the Russian Federation
- ↑ 5.13. Fertility, mortality and natural population growth by region of the Russian Federation
- ↑ 5.13. Fertility, mortality and natural population growth by region of the Russian Federation
- ↑ 5.13. Fertility, mortality and natural population growth by region of the Russian Federation
- ↑ 5.13. Fertility, mortality and natural population growth by region of the Russian Federation
- ↑ 5.13. Fertility, mortality and natural population growth by region of the Russian Federation
- ↑ 5.13. Fertility, mortality and natural population growth by region of the Russian Federation
- ↑ 5.13. Fertility, mortality and natural population growth by region of the Russian Federation
- ↑ 5.13. Fertility, mortality and natural population growth by region of the Russian Federation
- ↑ 5.13. Fertility, mortality and natural population growth by region of the Russian Federation
- ↑ 5.13. Fertility, mortality and natural population growth by region of the Russian Federation
- ↑ 5.13. Fertility, mortality and natural population growth by region of the Russian Federation
- ↑ 5.13. Fertility, mortality and natural population growth by region of the Russian Federation
- ↑ 1 2 3 4 4.22. Fertility, mortality and natural population growth in the constituent entities of the Russian Federation
- ↑ 1 2 3 4 4.6. Fertility, mortality and natural population growth in the constituent entities of the Russian Federation
- ↑ Fertility, mortality, natural growth, marriage, divorce rates for January-December 2011
- ↑ Fertility, mortality, natural growth, marriage, divorce rates for January-December 2012
- ↑ Fertility, mortality, natural growth, marriage, divorce rates for January-December 2013
- ↑ Fertility, mortality, natural growth, marriage, divorce rates for January-December 2014
- ↑ 1 2 3 4 5 6 7 8 9 10 11 12 13 14 15 16 17 18 19 20 21 Life expectancy at birth, years, year, indicator value for the year, the entire population, both sexes
- ↑ 1 2 3 Life expectancy at birth
- ↑ Censuses of the population of the Russian Empire, USSR, 15 new independent states
- ↑ Volumes of the official publication of the results of the 2010 All-Russian Population Census
- ↑ Demoscope. All-Union Census of 1926. The national composition of the population by region of Russia: Murmansk province
- ↑ Demoscope. All-Union Census of 1939. The national composition of the population by regions of Russia: Murmansk Oblast
- ↑ Demoscope. All-Union Census of 1959. The national composition of the population by regions of Russia: Murmansk Oblast
- ↑ Demoscope. All-Union Census of 1989. The national composition of the population by regions of Russia: Murmansk Oblast
- ↑ 2002 All-Russian Census : Population by Nationality and Russian Language Proficiency by Subjects of the Russian Federation
- ↑ Official website of the 2010 All-Russian Population Census. Information materials on the final results of the 2010 All-Russian Population Census
- ↑ 2010 All-Russian Population Census. Official results with extended lists by national composition of the population and by region. : see
- ↑ Arena (Atlas of religions and nationalities of Russia)
- ↑ Murmansk region. Religion