


Euler diagrams ( Euler circles ) - a geometric diagram with which you can depict the relationship between the subsets , for visual representation. Their first use is attributed to Leonard Euler. It is used in mathematics , logic , management and other applied areas. They should not be confused with Euler-Venn diagrams. .
Euler diagrams are also called Euler circles. Moreover, “circles” is a conditional term, instead of circles there can be any figures.
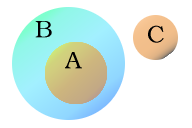
On Euler diagrams, sets are represented by circles (or other shapes). Moreover, disjoint sets are depicted by disjoint circles, and subsets are represented by nested circles. For example, the diagram in the figure shows that the set A is a subset of B , and B does not intersect C.
Content
History
In solving a number of problems, Leonard Euler used the idea of representing sets using circles. However, even before Euler, this method was used by the outstanding German philosopher and mathematician Gottfried Wilhelm Leibniz . Leibniz used them for a geometric interpretation of the logical connections between concepts, but at the same time he preferred to use linear schemes. [one]
But L. Euler himself developed this method quite thoroughly. The method of Euler circles was also used by the German mathematician Ernst Schroeder in the book “Algebra of Logic”. Graphic methods reached a special peak in the writings of the English logician John Venn , who detailed them in the book "Symbolic Logic", published in London in 1881 . Venn proposed his scheme of depicting the relationship between sets, which is now called Euler-Venn diagrams . Initially, Euler circles arose on the basis of the ideas of the syllogistics of Aristotle. Venn diagrams were created to solve mathematical logic problems. Their main idea of decomposition into constituents arose on the basis of the algebra of logic [2] .
Relationship between Euler and Venn Diagrams
Euler - Venn diagrams , unlike Euler diagrams, depict all combinations properties, that is, a finite Boolean algebra . At the Euler – Venn diagram is usually depicted in the form of three circles with centers at the vertices of an equilateral triangle and the same radius approximately equal to the length of the side of the triangle.
In fig. Below are Venn and Euler diagrams for 3 sets of single-valued positive integers:
Euler diagram
venn diagram
Sometimes, if some combination of properties corresponds to an empty set, then this combination is painted over. The figure on the right shows 22 substantially different Venn diagrams with 3 circles (top) and the corresponding Euler diagrams (bottom) . Some of the Euler diagrams are not typical, and some are even equivalent to Venn diagrams . Black areas indicate that there are no elements (empty sets).
Examples
The figure below is an Euler diagram illustrating the fact that many creatures with 4 limbs are a subset of animals that do not intersect with many minerals .
See also
- List of objects named after Leonhard Euler
- Villarso Circles
- Venn diagram
Notes
- ↑ Leibniz GW Opuscules et fragments inédits de Leibniz. - Paris, 1903. - p. 293-321.
- ↑ Kuzichev, 1968 , p. 25.
Literature
- Kuzichev A.S. Venn diagrams. History and applications. - M .: Nauka, 1968 .-- 249 p.