The population of Japan as of December 2018 was 126,087,131 people. In 2018, the population of Japan decreased by approximately 148,959. Given that the population of Japan at the beginning of the year was estimated at 126,236,090 people, the annual increase was -0.12%
| Japan Population History | |
|---|---|
| Year | Population |
| 25,000 BC e. | 10,000 |
| 15,000 BC e. | 30,000 |
| 10,000 BC e. | 20,000 |
| 6100 BC e. | 20,000 |
| 3200 BC e. | 110,000 |
| 2300 BC e. | 260,000 |
| 1300 BC e. | 160,000 |
| 1000 BC e. | 260,000 |
| 900 BC e. | 80,000 |
| one | 2 600 000 |
| 250 | 3,000,000 |
| 500 | 4,000,000 |
| 600 | 4 970 000 |
| 900 | 6,440,000 |
| 1150 | 6 920 000 |
| 1330 | 9 750 000 |
| 1500 | 11,260,000 |
| 1600 | 12,000,000 |
| 1650 | 17,180,000 |
| 1700 | 27,000,000 |
| 1710 | 27,415,000 |
| 1720 | 27,723,000 |
| 1730 | 28,034,000 |
| 1740 | 28 349 000 |
| 1750 | 28,668,000 |
| 1760 | 28,990,000 |
| 1770 | 29,316,000 |
| 1780 | 29 645 000 |
| 1790 | 29 978 000 |
| 1800 | 30 315 000 |
| 1810 | 30,656,000 |
| 1820 | 31,000,000 |
| 1830 | 31,293,000 |
| 1840 | 31,644,000 |
| 1850 | 32,000,000 |
| 1860 | 33,174,000 |
| 1870 | 34 347 000 |
| 1880 | 36,807,000 |
| 1890 | 40,077,000 |
| 1900 | 44,774,000 |
| 1910 | 50 368 000 |
| 1920 | 55,962,000 |
| 1930 | 64,451,000 |
| 1940 | 73 144 000 |
| 1950 | 83 625 000 |
| 1960 | 94,096,000 |
| 1970 | 104 331 000 |
| 1980 | 116 807 000 |
| 1990 | 123 537 000 |
| 2000 | 127 034 000 |
| 2009 | 127 082 046 |
| 2015 | 126,910,000 |
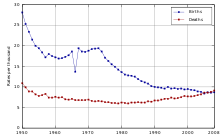
Fertility - 7.93 per 1000 (2015).
Mortality - 9.51 per 1000 (2015).
The annual population decline is 0.191% (2009), approximately 250 thousand people.
The average life expectancy is 80.0 years for men, 86.4 years for women [1] .
Literacy - 99% of men, 99% of women [2] .
Ethnic and racial composition: Japanese 98.5%, Koreans 0.5%, Chinese 0.4%, other 0.6%.
Content
Japan's population
At the beginning of the Tokugawa era, the population of Japan was 10-20 million people (most historians write about 15-16 million as the most likely figure). According to the census of 1721, the population of Japan was 26 million 65 thousand 425 people, but, according to Japanese historians, together with the underestimated population, the number was about 30 million people. The last census of 1846 with the shogun totaled 26 million 907 thousand 600 people. For 125 years from 1721 to 1846, the population of Japan grew by a little more than 3%. The main reason for this slow population growth was the low productivity of subsistence agriculture. Natural disasters, crop failures, famine, an increase in the urban population and demographic imbalance contributed to this. In 1603-1732, the population of Japan grew and reached almost 27 million people, excluding warriors. The famine of Kehoe reduced the country's population by 850 thousand by 1750. Over the next 30 years, the population of Japan remained roughly the same. The great famine of Temmei of 1783-1787 reduced the population of Japan by more than 1 million people. After that, until the 1830s, the population of Japan grew and again reached the figure of 27 million people. The great famine of Tempo 1833-1836 again reduced the population of Japan by a million people [3] .
In the 18th century, population growth in Japan stopped due to a general cooling of the climate, crop failures, rising mortality and falling birth rates. In this regard, the Japanese authorities began to actively combat the killing of newborns and abortion. The earliest ban on killing newborns and abortion was issued in the Satsuma principality of Kagoshima Prefecture in the early 17th century, but most of these decrees appeared in the late 17th and early 18th centuries. Some authors consider these decrees to be the earliest example of a family support policy in adverse demographic conditions [3] .
In 2009, the population of Japan was 127,078,679. According to 2007 data, there were about 130 million Japanese people in the world. Outside of Japan, the largest Japanese communities are in Brazil (1.4 million people) and in the United States (1.3 million people). According to 2007 data, there were 10 millionaire cities in Japan: Tokyo (13.05 million inhabitants), Yokohama (3.27 million), Osaka (2.48 million), Kobe (1.46 million), Nagoya (2.1 million), Kyoto (1.46 million), Sapporo (1.90 million), Hiroshima , Fukuoka , Kawasaki (1.1 million).
In terms of population, Japan is among the top ten countries in the world. However, over the past decade, the nature of the natural population movement has changed dramatically. The peak of the population of the “Land of the Rising Sun” occurred in December 2004 - then it exceeded 127.84 million. Japan became the first state in Asia to switch from the second to the first type of its reproduction. So in 2005, the population of Japan declined for the first time. This is due to the fact that the number of children born since the mid-1990s is below the level for the natural reproduction of the population . As of 2013, it amounted to 127.3 million citizens. A major problem for Japan was the rapid increase in the proportion of people over 65. Life expectancy in this country is one of the highest in the world (76 years for men, 82 years for women). The population of Japan is distinguished by racial, national and linguistic homogeneity (more than 99% are Japanese). Nevertheless, about 600 thousand Koreans live in the country, although many of them were born and raised on the islands, speak Japanese and mostly have Japanese names. Of the other nationalities, the number of Chinese living is significant. Also stand out are the Rukians , this and Ainu . There is also a small Jewish diaspora in Tokyo and Kobe.
Age structure
| Year | 0-14 years old: (men) | 0-14 years old: (women) | 0-14 years old: (% of total) | 15-64 years old (men): | 15-64 years old (women): | 15-64 years old (% of total): | 65 years and more (men): | 65 years and more (women): | 65 years and more (% of total): |
|---|---|---|---|---|---|---|---|---|---|
| 2007 | 9 024 344 | 8 553 700 | 13.8% | 41,841,760 | 41 253 968 | 65.2% | 11 312 492 | 15 447 230 | 21% |
| 2009 | 8 804 465 | 8 344 800 | 13.5% | 41 187 425 | 40 533 876 | 64.3% | 11 964 694 | 16 243 419 | 22.2% |
| 2010 | 8 665 440 | 8 212 680 | 13.3% | 40 969 829 | 40 291 648 | 64.1% | 12 163 028 | 16 501 808 | 22.6% |
Fertility
The example of Japan contradicts the theory of the demographic transition , according to which the birth rate goes from a traditionally high level through a gradual decline to a low level in highly developed countries. In Japan, on the contrary, after a sharp drop in the birth rate from 1650 to 1700 and a more gentle fall in the birth rate in the 18th century, there was a transition from a low birth rate in the 18th century through a gradual increase in the first half of the 19th century to a high birth rate in the Meiji era with a historical peak around 1920 and only then began a constant decline in fertility. For example, in Eastern Japan , from 1700 to 1800, the total fertility rate was approximately 3.5 children per woman, which is much lower than the birth rates not only in China, but also in European countries of that era (about a third, and according to other data, 40% of children were killed at birth), by 1850 each family already had 4 or 5 children (and the population began to grow), in the 1880s this indicator grew, for 30 years it was at a stable level of 5 children per one woman, then rose to 6 in the 1910s-1920s, and between 1920s and 1950s ASTERN Japan had the highest birth rate in its history. Low birth rates and the widespread practice of killing newborns combined with high child mortality: for example, in the 19th century, only 67% of girls lived to be 7 years old. As a result, during the 18th century, each next generation was smaller than the previous one ( net reproduction rate below 1), at the beginning of the 19th century this indicator began to grow, after 1840 the number of new generations exceeded the number of generations of their parents (net reproduction rate is more than 1), and in the 1920s the number of new generations was 2 times higher than the previous ones (net reproduction rate 2), in the 1950s this indicator fell by almost half, and only in the last 20 years the net reproduction rate returned to ur Aries of the 18th century [4] .
Japan later than other developed industrial countries embarked on a decline in marriage birth rates: intra-family birth control appeared in Japan only at the end of the Meiji era in the early 20th century [5] .
In 2005, the population of Japan decreased for the first time, since for a long time the birth rate in the country has been below the simple reproduction of the population (1.4 children per woman). Japan, which practically does not accept immigrants , will be in the future in a predictable demographic crisis, in which a small number of workers will have to contain a large mass of pensioners.
In 2006, for the first time in many years, the birth rate in Japan increased slightly, increasing by 12,707 compared to 2005. In total, in 2006, 1,096,465 Japanese were born in the Land of the Rising Sun. The increase is observed now. However, this still does not allow us to talk about a significant improvement in the demographic situation in the "Land of the Rising Sun": its population so far has a tendency to decrease. According to 2008 data, the birth rate in this country is 7.87 births per 1000 population.
Total fertility rate
There are about seventy countries in the world where the total birth rate is below 2.1. One of the countries with the lowest birth rate is Japan. In this country, an average woman gives birth to 1.4 children over her entire reproductive period (2018) [1] . Since Japanese law does not encourage immigration, Japan is now among the countries where the population is declining due to negative natural growth. Liberalization of migration legislation will not be able to significantly change the situation, since in the Japanese economy there is a shortage of jobs and youth unemployment is quite large, and in most East Asian countries the demographic situation is close to the Japanese .
Mortality
Mortality in Japan is 9.26 deaths per 1000 population (2008).
The life expectancy of the population of Japan is well known - its inhabitants live on average longer than anyone in the world. Japan's infant mortality rate is considered one of the lowest in the world. Residents of Japan can be considered the most enduring in comparison with residents of other countries. But at the same time, the mortality rate among children (from 1 year to 4 years) in Japan ranks second among 13 most developed countries in the world.
The main causes of child mortality are: accidents, various illnesses and “violence”. The country has a low level of killing of children (from 1–4 years old), only 0.72 children are killed per 10,000 children.
Religious composition
Currently, the vast majority of the population of Japan is officially considered the followers of Shintoism (approximately 83.9% of the country's inhabitants), which is considered the national Japanese religion , and Buddhism (71.4%), brought from China . [6] At the heart of Shintoism is the veneration of ancestors and the cult of nature. The objects of worship are the souls of the dead and various deities. The total number of believers exceeds the population of Japan due to the widespread practice of religious syncretism . Traditionally, most Japanese profess both Shinto and Buddhism.
There are also adherents of other religions, mainly Christianity (2%), primarily Catholicism and various areas of Protestantism . [6] At the same time, the attitude of most Japanese people to religion is manifested mainly on the external level, primarily as part of the tradition. Thus, according to Professor Robert Kisal, only 30% of the population identify themselves as believers. [7]
Family in Japan
Family in Japan is the main unit of modern society. According to statistics from 1997, there are 44.67 million families in Japan (even men and women who live alone or have been divorced are considered to be families). 24.5% of families have two family members (there are also childless families or single-parent families with one child), 18.3% - families of three, 18.9% - families of four, 7.4% - families of five people, 5.8% - families of six or more people. In the 2000s, the trend towards a decrease in the average number of Japanese families continued. For 2000, S. B. Markaryan, citing official statistics, calculated the following data for Japanese families: 27.6% - one person, 7.7% - one parent with a child, 18.9% - a married couple without children, 31 , 9% - a married couple with children, 7.6% - a family of three generations, 6.3% - others [8] . In 2010, S. B. Markaryan gave the following picture: 32.4% - one person, 8.6% - one parent with a child, 19.8% - a married couple without children, 27.8% - a married couple with children, 4.7% - a family of three generations, 6.7% - others [8] .
Family Forms
Throughout the history of family forms in Japan, several variants of family forms can be distinguished. From an elitist matrilocal form to patrilineal. The elitist matrilocal form is when the husband goes to live in his wife’s ancestral home (in the Heian era), and the patrilineal form is when the father is considered the head of the family and when the family has uninterrupted family inheritance through the male line. The most common form of family is the patrilineal form.
The role of women in the family
In the predominant number of cases, the woman in the family is a housewife sitting at home with children and not working outside the home. The woman is responsible for the rational distribution of funds, cuisine, and parenting. She was at the same time a home economist, and an accountant, and a cook, and an educator, and also often a weaver, a dressmaker, etc. In other words, she almost completely carried out housekeeping . But due to the decline in the country's economy, some women in the Japanese family now work part-time or part-time, which they call “arubaito” (from the German word “arbeiter”). At the moment, there are enough such Arubaito women in Japan. This is due to the financial problems of the family, mainly related to the payment of children's education, as well as the payment of a loan to purchase a home or pay for its hiring. The right of choice for the birth of a new family for a girl, it has been so for a long time. This is mentioned in ancient scriptures, legends and tales. Everything was easy: if a girl liked a young man or any other free man, then she could come to him and ask him to marry her.
The role of men in the family
For men in the Japanese family, the honorable functions of possession and command. Its main function is clear - to earn money for the maintenance of the family. At the same time, the role of the “absolute ruler” and overlord is often only part of etiquette and carries only a decorative and ritual burden, while in reality a woman in a Japanese family can have no less, and sometimes even a greater measure of power and responsibility than in European families . This happened due to the fact that even in ancient times the samurai was either absent for most of his time, fought for his clan somewhere, or honed his martial art .
Age and sex structure
- Left : Men
- Right : women.
- Y- axis : age
- Abscissa axis: quantity (in tens of thousands)
1920 | 1925 | 1930 | 1935 |
1940 | 1945 | 1950 | 1955 |
1960 | 1965 | 1970 | 1975 |
1980 | 1985 | 1990 | 1995 |
2000 | 2005 | 2010 | 2015 |
Emigration to Japan
In Japan, there are very few migrants from other countries, which is facilitated by the geographic remoteness of the country from the poor states supplying refugees. In addition, Japanese authorities almost never grant refugee status. For example, in 2015, according to the Ministry of Justice of Japan, about 7.6 thousand applications for refugee status were received, of which only 27 were satisfied (in 2014 there were about 5 thousand applications, of which only 16 were satisfied) [9] . The majority of refugee status applicants in 2015 were from Indonesia , Nepal and Turkey [9] .
See also
- Japan Census
- Discriminated Populations in Japan
- Burakumin
Notes
- ↑ 1 2 UNdata unspecified . data.un.org. Date of treatment February 25, 2019.
- ↑ https://www.cia.gov/library/publications/the-world-factbook/geos/ja.html
- ↑ 1 2 Alexander Prasol. From Edo to Tokyo and back. Culture, life and customs of Japan of the Tokugawa era. Population
- ↑ Mabiki, Infanticide and Population Growth in Eastern Japan, 1660-1950 - Fabian Drixler
- ↑ Selected Demographic Works: In Two Volumes, Volume 1 Demographic Theory and Demographic History. page 135. Anatoly G. Vishnevsky Science, 2005 - Total pages: 366
- ↑ 1 2 World Factbook; Japan CIA (12/23/2009) (English)
- ↑ Kisala, Robert. The Logic Of Nothingness: A Study of Nishida Kitarō / Robert Wargo. - University of Hawaii Press, 2005. - P. 3-4. - ISBN 0824822846 .
- ↑ 1 2 http://japanstudies.ru/images/books/japan_2013.pdf (inaccessible link)
- ↑ 1 2 Japan in 2015 accepted 27 refugees out of 7.6 thousand